Research Visualizations
Key findings from our comprehensive exploratory data analysis
TAM AIR Club × CAL FIRE × UCI × UCSF
Our research initiative aims to build a pixel-wise wildfire risk prediction system for California at 800m × 800m resolution using machine learning. By analyzing over 147 years of fire perimeter data, we're developing tools to help predict and prevent catastrophic wildfires.
This collaboration brings together high school researchers, university academics, and California's fire management professionals to tackle one of the state's most pressing environmental challenges.
Our multi-phase approach to building a wildfire prediction model
Comprehensive analysis of 22,000+ fire perimeters. Created 19 publication-quality visualizations. Identified key patterns and data quality thresholds.
Analyze fire ignition point dataset to understand fire origin patterns, causes, and spatial distribution across California.
Analyze vegetation and fuel load data to understand how different land cover types influence fire behavior and spread.
Incorporate elevation, slope, aspect, and water body data to understand terrain influences on fire risk and natural fire breaks.
Integrate PRISM climate data including temperature, precipitation, and vapor pressure deficit to model weather-driven fire risk.
Analyze human infrastructure data including population density, road networks, and electrical lines as ignition risk factors.
Synthesize findings from all datasets to form research hypotheses and develop methodology for statistical analyses.
Conduct multiple statistical analyses to identify significant predictors and build predictive models for wildfire risk.
Develop backend and frontend web application to deliver research results and predictive tools to CAL FIRE personnel.
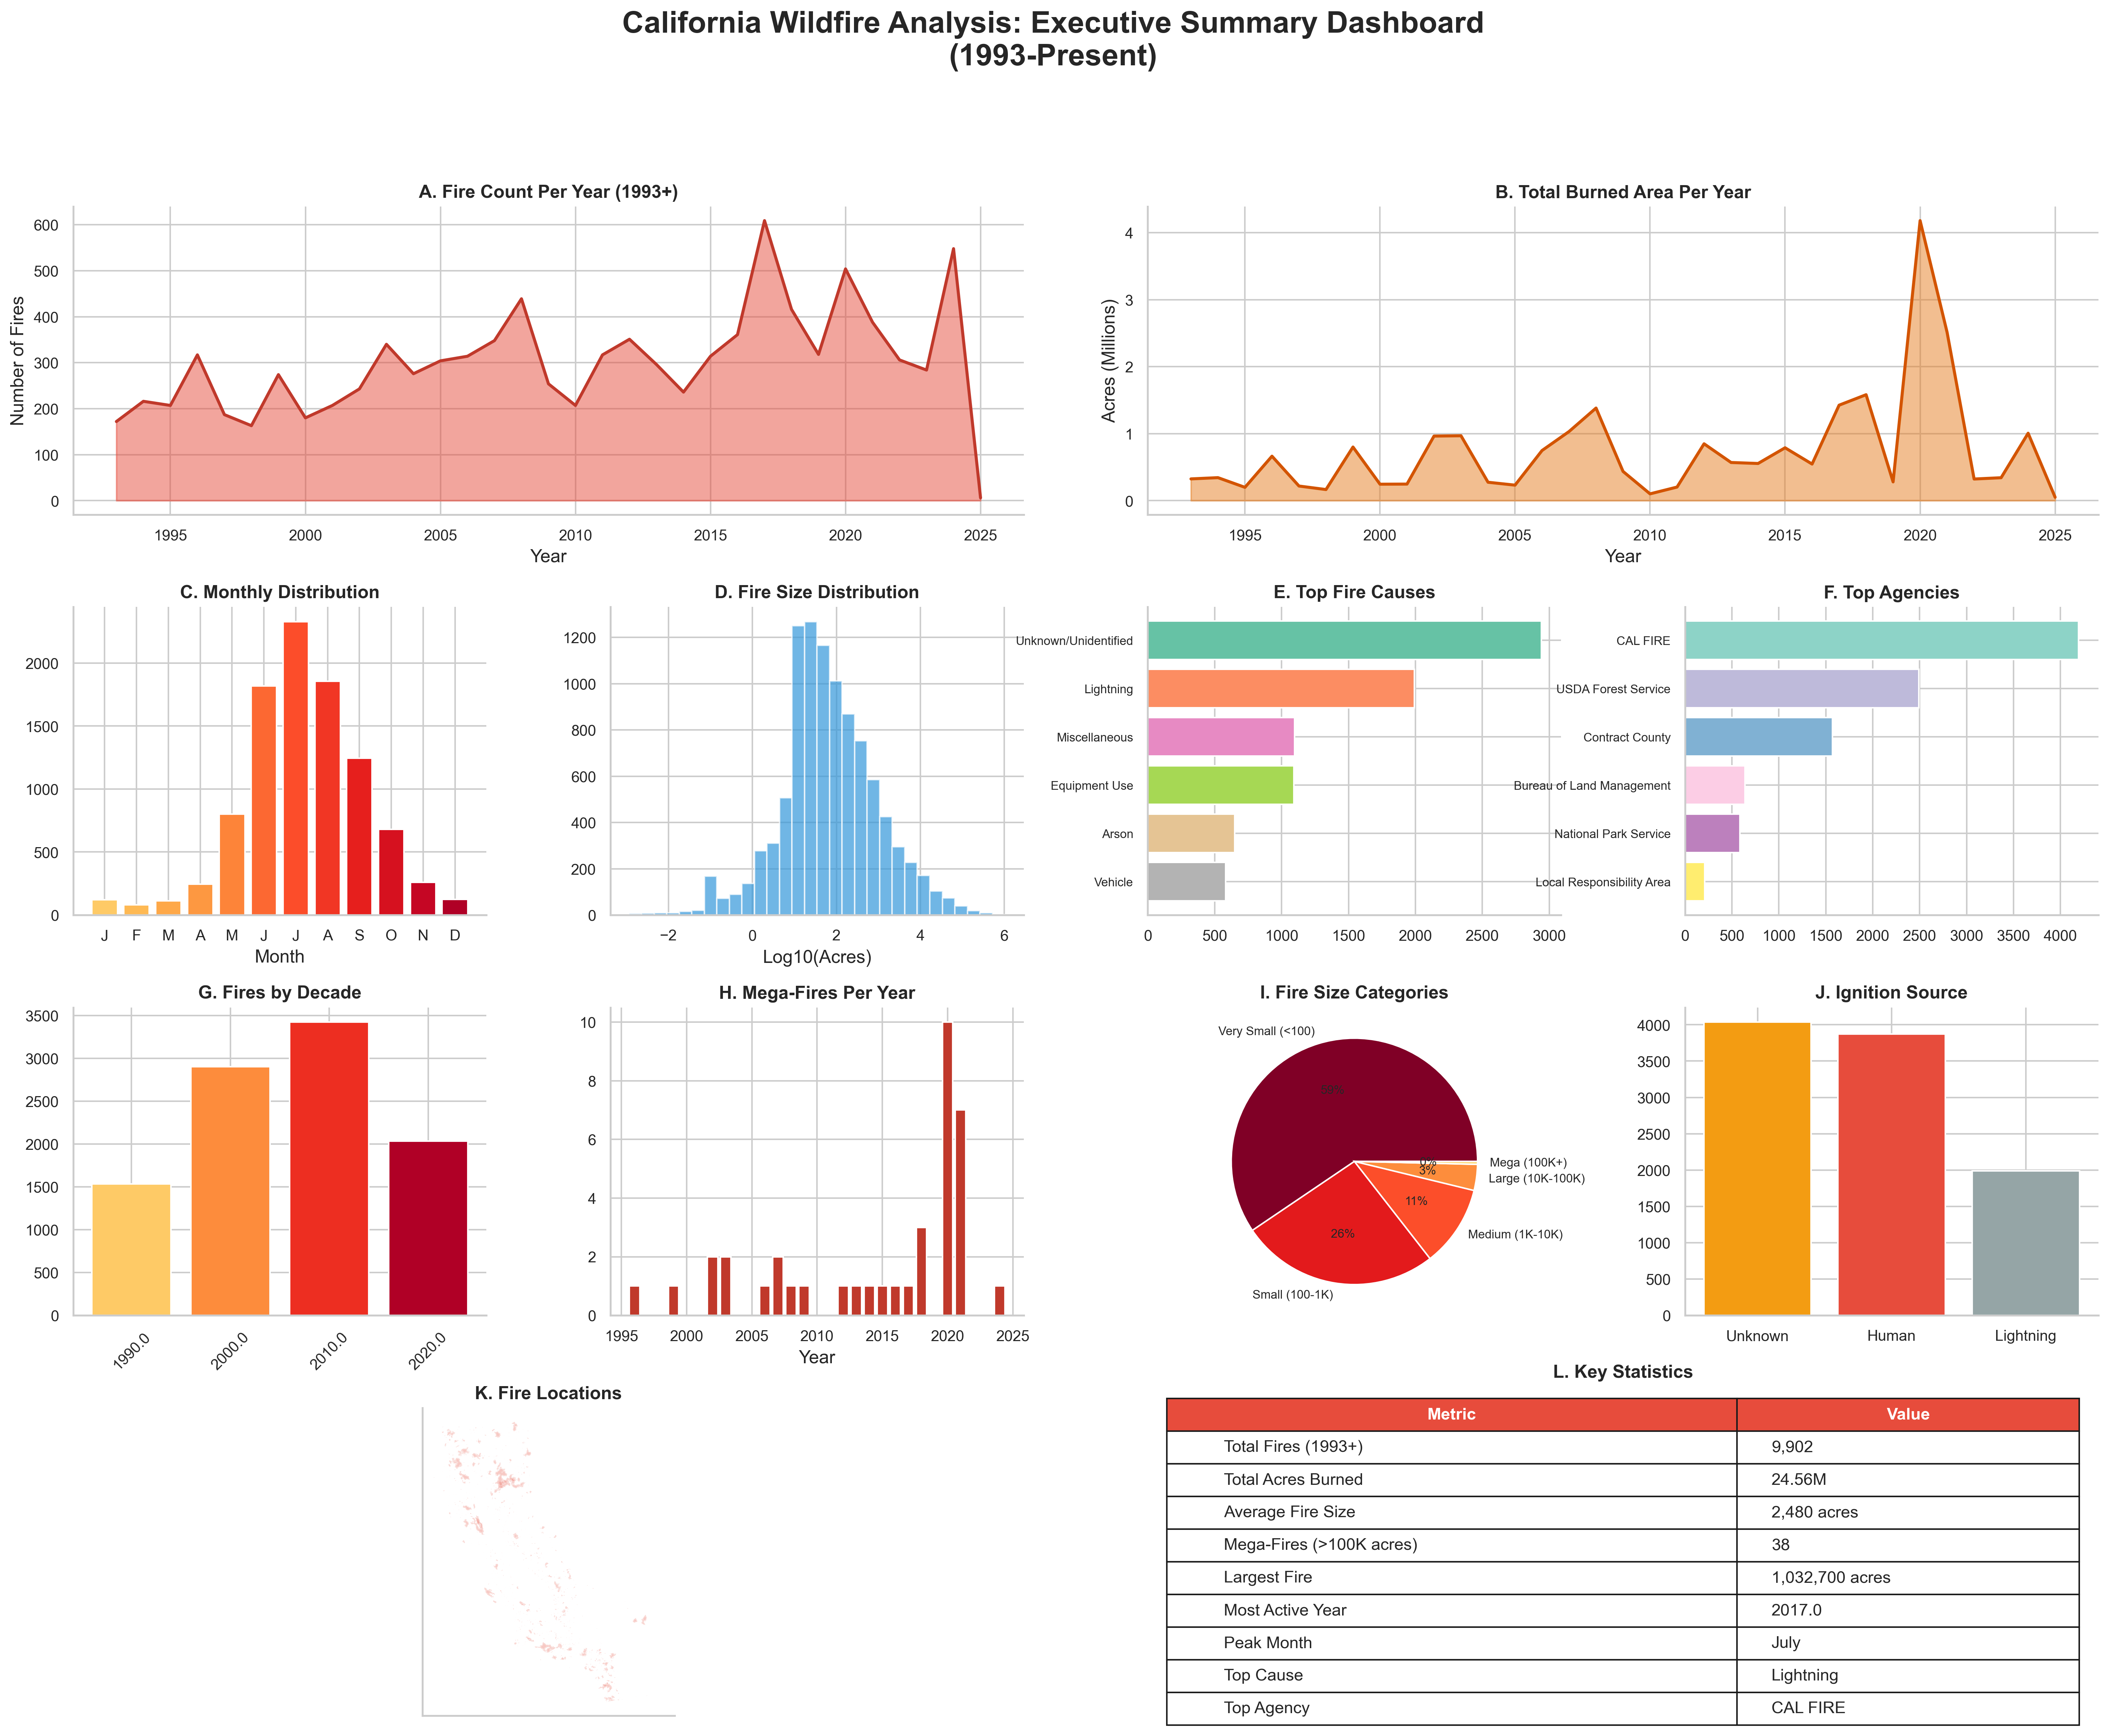
Critical insights from our exploratory data analysis
Acres burned in 2020 alone - California's worst fire year on record
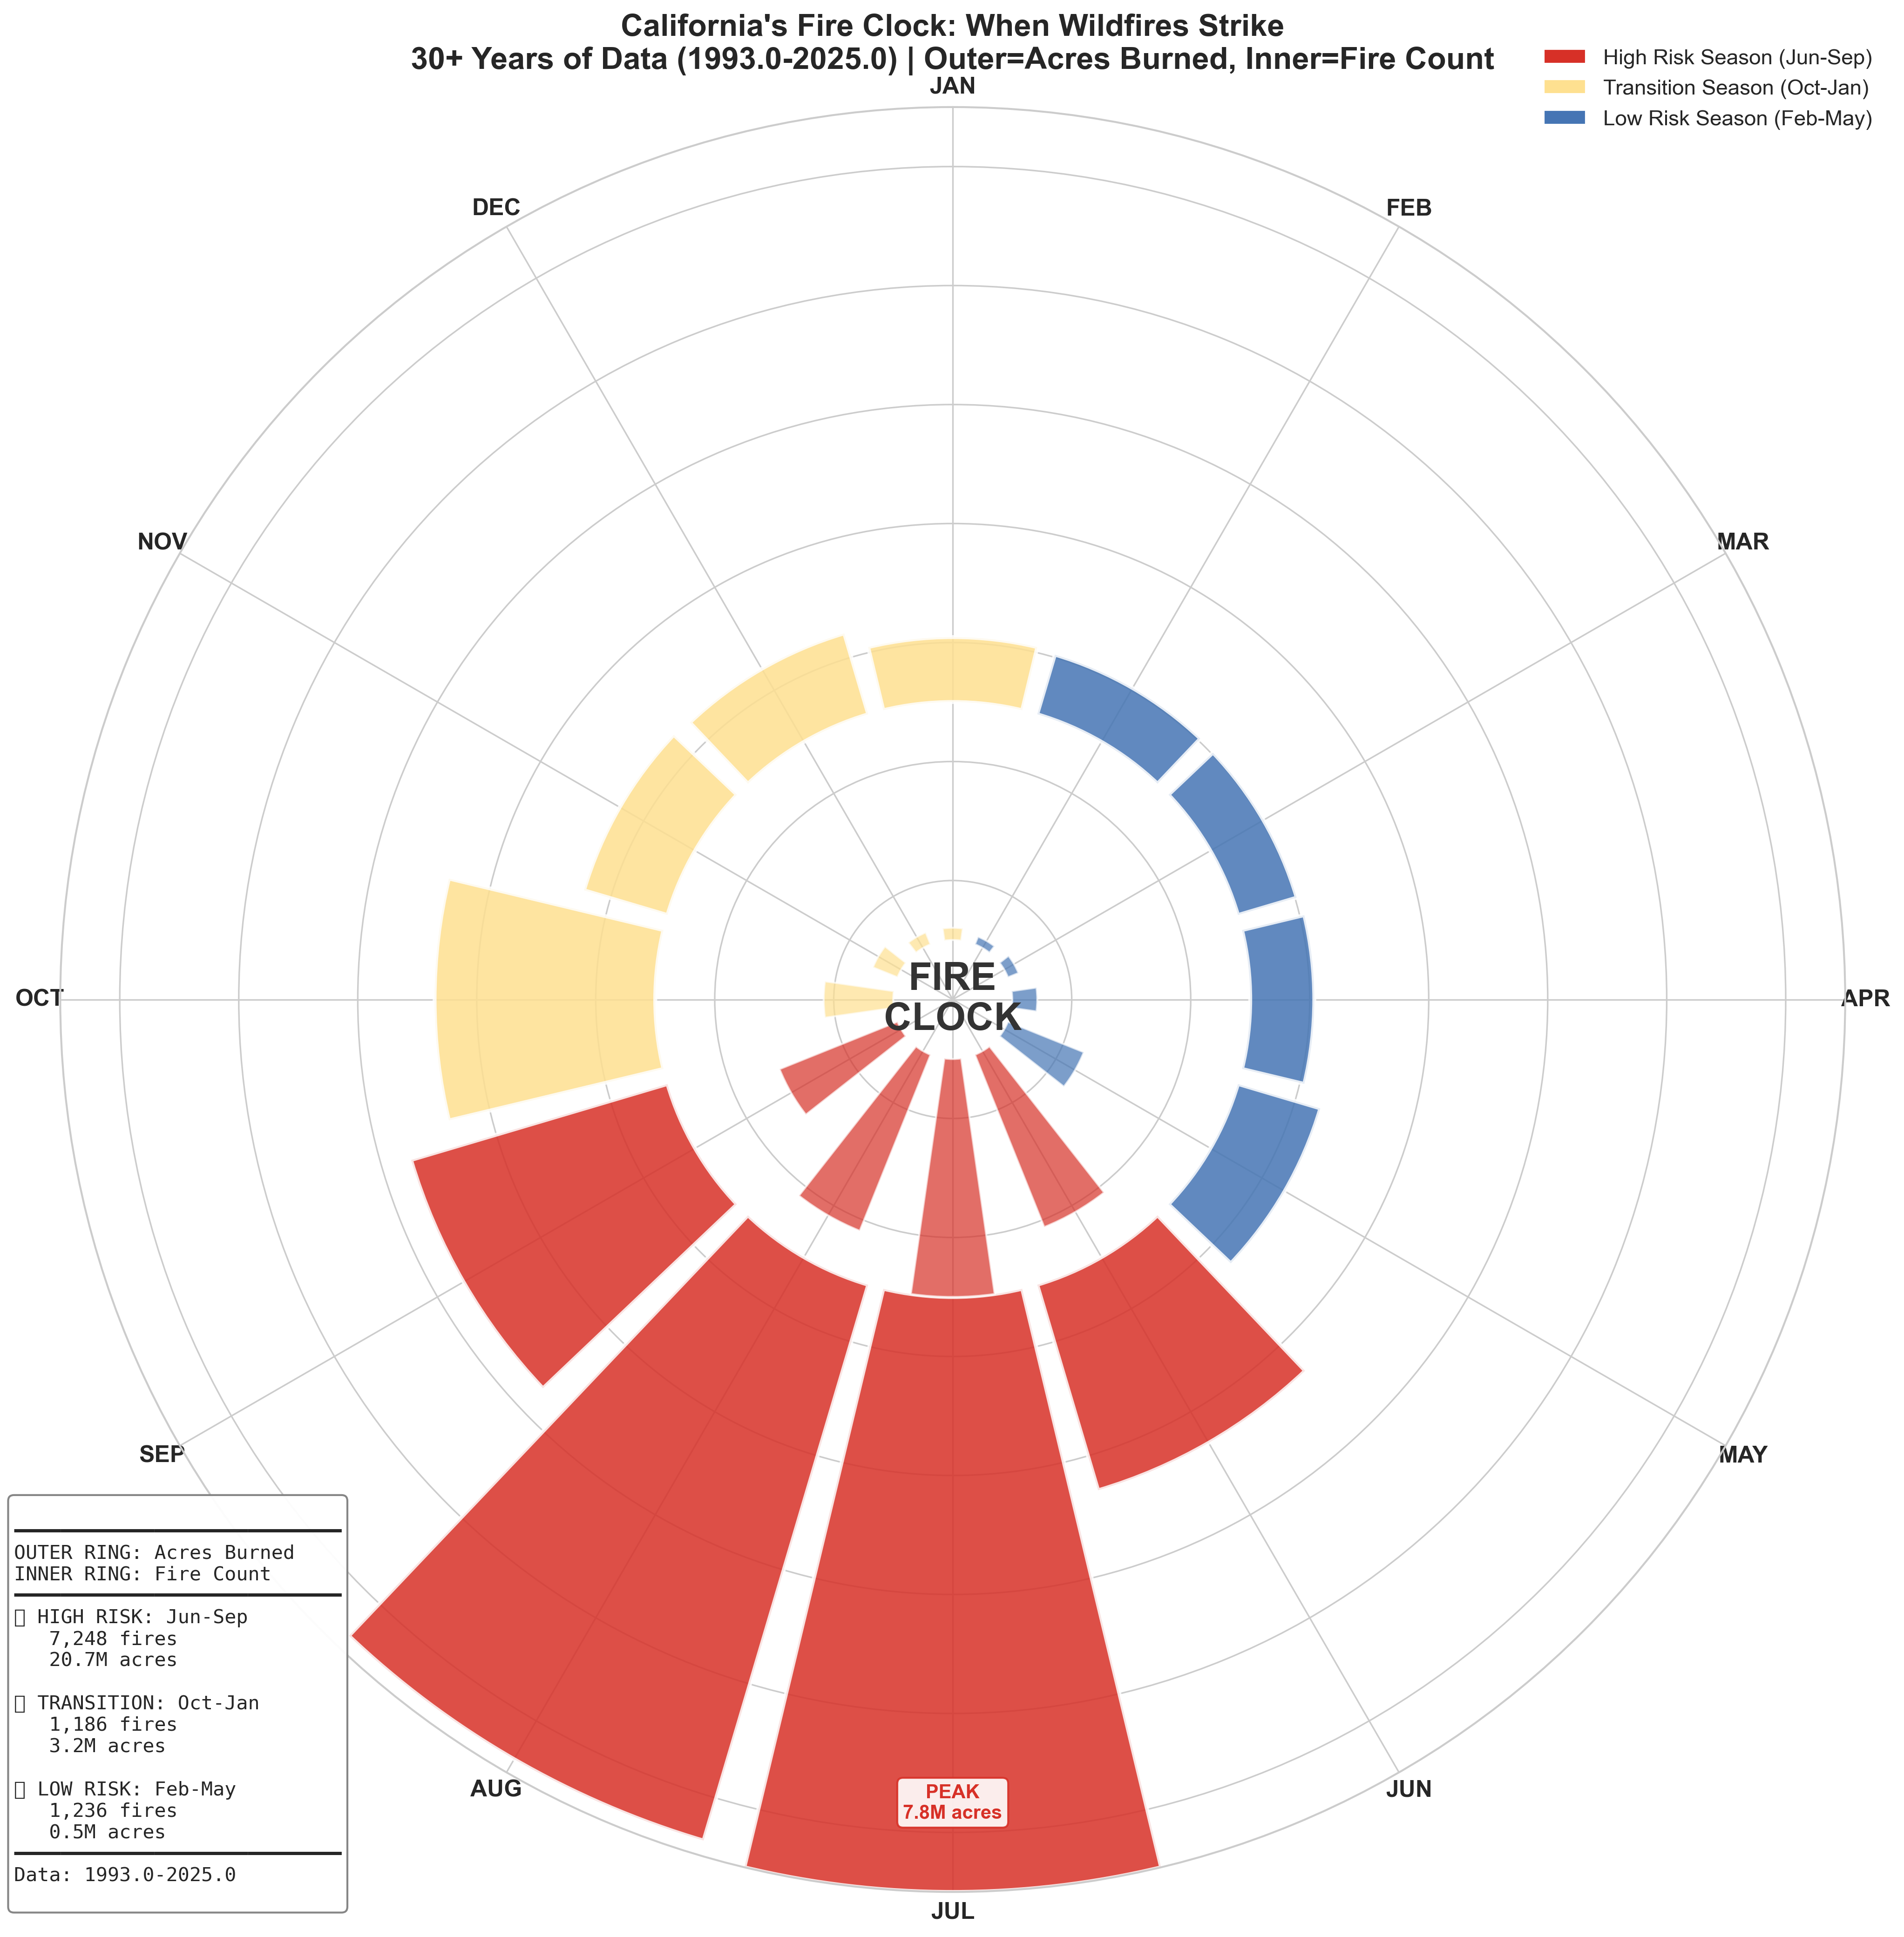
Of burned acreage occurs during June-September fire season
Of fires cause 58% of all damage - extreme concentration of risk
Fires exceeding 100,000 acres recorded since 1993
Key findings from our comprehensive exploratory data analysis
Explore all 38 mega-fires (>100,000 acres) recorded since 1993
Click below to explore the full interactive map with all mega-fire perimeters, details, and filtering options.
Open Interactive MapNote: Large file (~35MB). Best viewed on desktop.
Download our comprehensive analysis report and explore the methodology
Complete exploratory data analysis with 19 high-resolution figures, statistical findings, and methodology documentation.
Download PDF (3.6 MB)View our analysis notebooks with full code, methodology explanations, and reproducible results using Python and GeoPandas.
View on GitHubThis research is made possible through collaboration
Student-led research team from Tamalpais High School
CAL FIRE - California Department of Forestry and Fire Protection
UC Irvine - Environmental Science
Research Collaborator - UCSF
Research Collaborator - UCSF
Research Collaborator - UCSF
Learn more about our other projects and how you can support our mission to protect California from wildfires.